Available by Email Only!
______________________________________________________________________________________________
AV Special Bulletin
# 17 1-20-25
______________________________________________________________________________________________

Bond
Market to FED: not so fast ! |
======================================================
"Helping investors make informed decisions
since 1985”
======================================================
The following information is the opinion of Jim
Patton, Broker and is based on his view of the
Antelope Valley real estate market & the economy. Political
issues may be discussed if their outcome could have a meaningful
effect on the nation’s economy. Redistribution
of this report is encouraged.
======================================================
Intro………..
In September of last year the FED just began its interest rate
cutting cycle, but apparently not everyone "got the memo”.
While the FED cut the Fed Funds rate, a short term rate, longer
term rates, like mortgage rates, actually rose. As of this writing,
30 year mortgage money is still over 7%. More on the how and why
of this below.
The AV Land Market
The AV land market through out 2024 remained in a trading range
of 80 to 100 sales per month in our local MLS. As a reminder,
monthly land sales are at about 1/2 the level they were prior
to the FED raising interest rates in March of 2022. The effect
was not immediate, but as home sales slowed, so did land sales.
While the land market is slower, its not dead. The market has
a pulse, land is still being sold, but sales are mostly investor
sales vs developer purchases. Developers are “kicking the
tires” though, looking at possible purchases. In the chart
below you can see that 2023 and 2024 were about the same in
overall sales volume. Versus 2022, land sales in 2024 were down
-16.4%. Versus 2021, the last full year without FED interference,
2024 sales were down - 43.5%. As you may recall, it was in March
2022 that the FED began to raise interest rates, weakening that
asset class across the board. Conclusion: the Antelope Valley
land market remains in a confirmed “buyer’s market”,
with buyers having most of the leverage in negotiating price.
Antelope Valley Land Sales Activity
| |
Mo Sales |
Supply |
M /M |
Y / Y |
| 2021 |
1,920 total |
|
|
|
| 2022 |
1,297 total |
|
|
|
| |
|
|
|
|
| Jan 2023 |
73 |
2,338 |
+10.4% |
-53.5% |
| Feb |
75 |
2,308 |
+2.7% |
-35.0% |
| March |
118 |
2,333 |
+57.3% |
-7.1% |
| April |
102 |
2,317 |
-13.5% |
-32.8% |
| May |
79 |
2,313 |
-22.5% |
-29.4% |
| June |
68 |
2,375 |
-13.9% |
-49.2% |
| July |
79 |
2,427 |
+16.2% |
-25.2% |
| Aug |
84 |
2,438 |
+6.3% |
-6.6% |
| Sept |
117 |
2,425 |
+39.3% |
+56% |
| Oct |
95 |
2,388 |
-18.8% |
+10.5% |
| Nov |
89 |
2,536 |
- 6% |
-18.6% |
| Dec |
91 |
2,432 |
+2.2% |
+35.8% |
| Total |
1,070 / 89 p/mo vs 2021 - 44% |
|
|
|
| |
Mo Sales |
Supply |
M /M |
Y / Y |
| |
|
|
|
|
| Jan 2024 |
117 |
2,367 |
+28.5% |
+60.2% |
| Feb |
98 |
2,373 |
- 16.2% |
+30.6% |
| March |
95 |
2,350 |
- 3.0% |
-25.2% |
| April |
105 |
2,384 |
+10.5% |
+2.9% |
| May |
86 |
2,420 |
- 18% |
+8.8% |
| June |
80 |
2,460 |
-6.9% |
+17.6% |
| July |
91 |
2,437 |
+13.7% |
+15.1% |
| Aug |
78 |
2,453 |
- 14.2% |
- 7.1% |
| Sept |
80 |
2,464 |
+2.56% |
-32.6% |
| Oct |
105 |
2,461 |
+31.2% |
+10.5% |
| Nov |
67 |
2,452 |
-36.1% |
-24.7% |
| Dec |
82 |
2,369 |
+22.4% |
+ 11% |
| Total |
1,084 / 90 p/mo vs 2021 - 43.5% |
|
|
|
Antelope Valley News
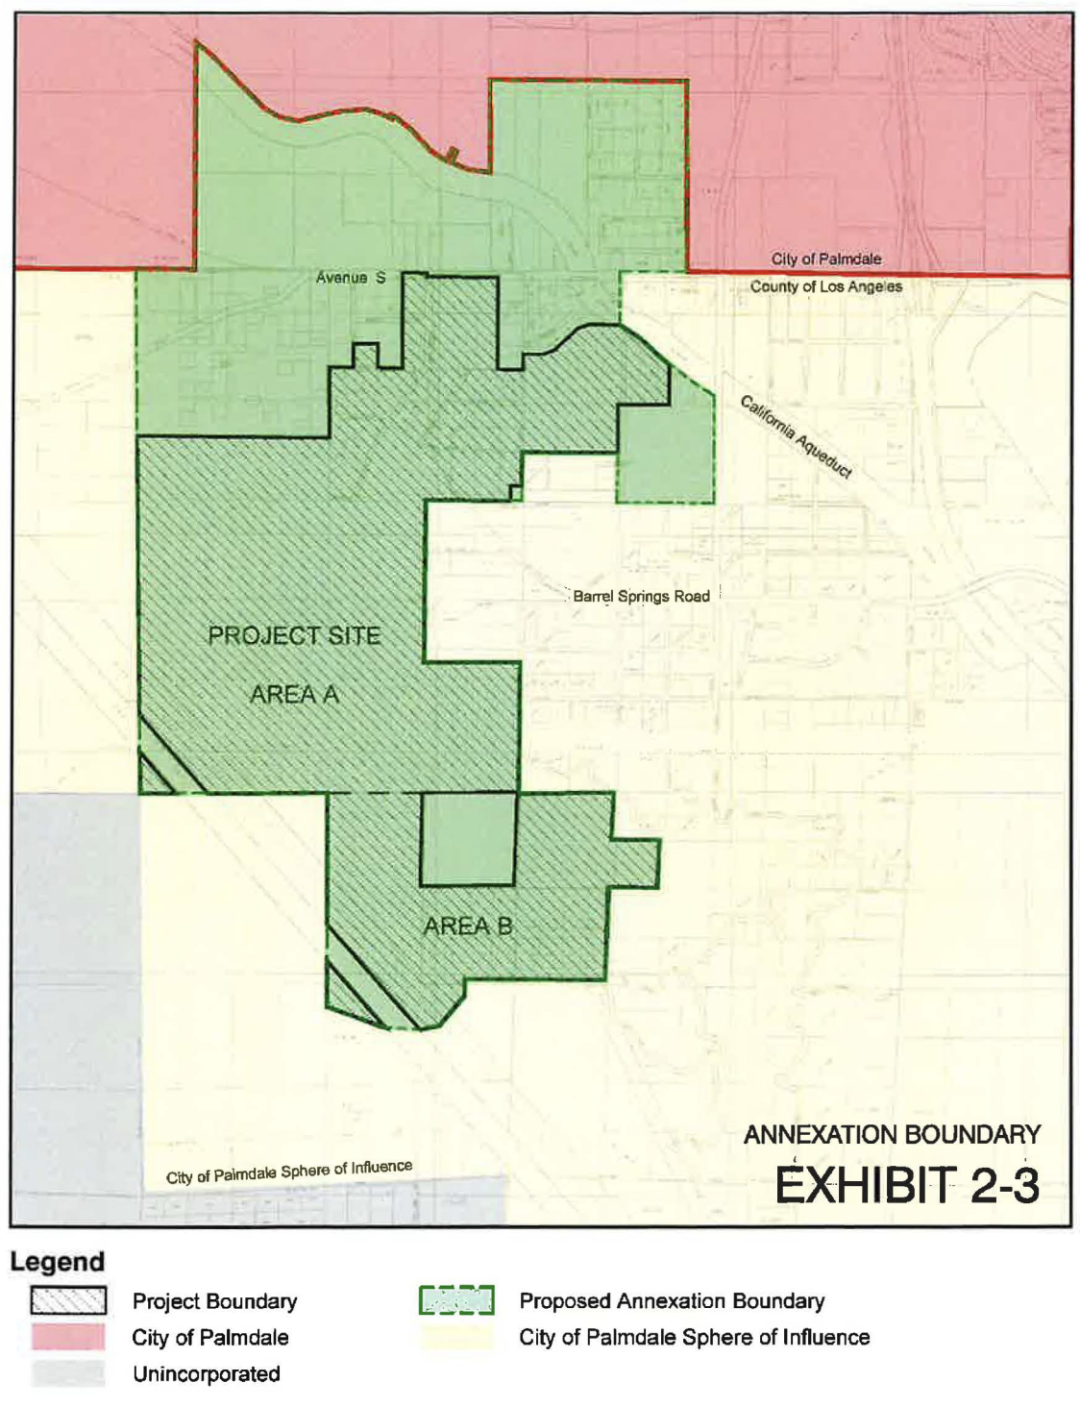
Nov 20- The City of Palmdale notifies,
by letter, all and owners in and around the Ava Verde area of
west Palmdale. The letter announces that huge amounts of acreage
are being annexed into the City of Palmdale, whereby now the area
is unincorporated. The land is being annexed into the City by
a developer for a residential project called Quail Valley Project.
The development will include 730 SF lots, with the lots being
1 acre and 1/2 acre in size. The land is south of Ave S and west
of Tovey Ave. The configuration is irregular and has both flat
areas and steep terrain. The tentativemap being worked up for
the project is numbered TM 65813.
What About Cal
Housing?
While the California housing market already
had its own challenges, the January fires will make those problems
even more complex. At first take, with 100’s of homes being
destroyed and removed from the market, one would think that less
supply would push prices up in the surviving areas. Months out,
that could happen, but it will take some time to play out. The
economy will also have its say that matter. This I do know, for
those that lost their home, even if they are fully insured, it
will be years until a replacement home is back up and finished.
Many home owners will opt to take their insurance money and buy
a home somewhere else. In Florida, after one of their hurricanes,
it took 4-5 years to get homes rebuilt. For those seeking
to rebuild in the affected areas, obtaining “affordable”
homeowners insurance will be an issue. In a few months, get ready
for stories hitting the TV news on the difficulty those seeking
to rebuild are having on getting through city, county, and state
regulations to get building permits. In LA County, regulatory
fees are approx 30% of the cost of a new home. In Cal, homes get
built in spite of government.
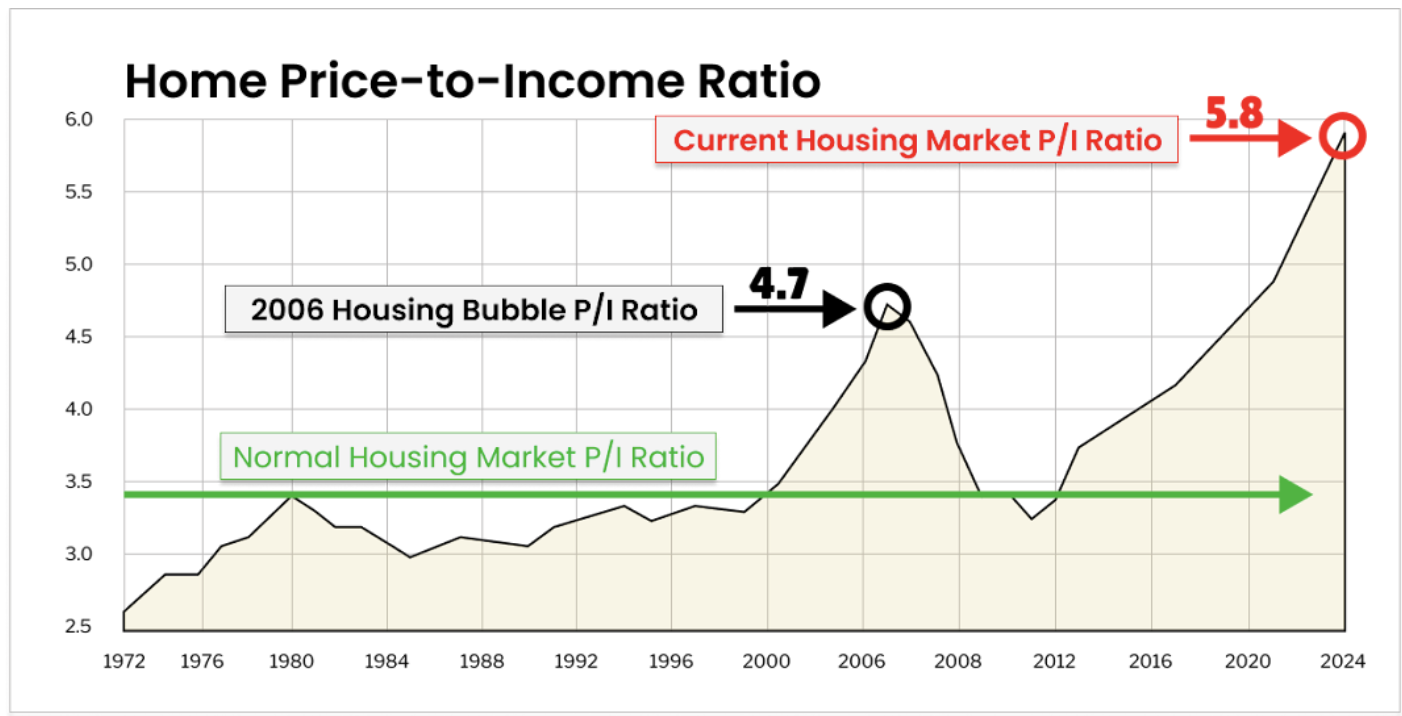
After a major run up in sales prices, I do not see housing prices
to continue this move up. This graph shows why. The gap
between the price of a home and income needed to buy a home, has
gone nearly parabolic. This gap launched in 2012 when the FF rate
was near zero and mortgage rates below 3%. Since 2020 alone, home
prices are up +50%. How much have incomes moved since 2020?
At best 10%. If adjusted for inflation, less.
As I see it, housing will muddle along over the next two years
as incomes play catch up and the housing market “digests”
these huge gains. More than likely, NO recession for housing,
just a slow down. The health of the housing
market is linked to interest rates, which in turn is linked to
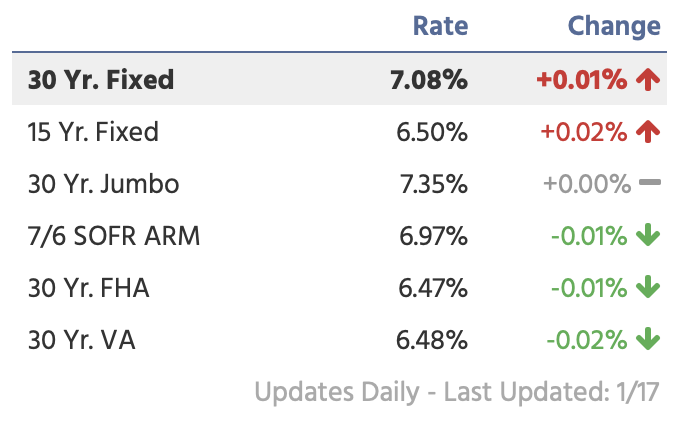
the inflation rate. More on that inter-relationship below.Mortgage
rates as of January 17th, 2025
Inflation
At this time, the only risk to the economy
would be rising inflation.At its peak, the CPI was at 9%. By raising
the Fed Funds rate, over time, the FED worked the inflation rate
lower. The most recent reading on the CPI
is from last December, +2.9% YoY. The FED still says that they
are aiming for an eventual inflation rate of 2%. Right now, on
a short term basis, the inflation rate is going in the wrong direction,
up not down, to reach 2%.
From 2010 through 2020, the CPI averaged between 2% and 2.5%,
so for the FED 2% is a logical target. Presently, the FED and
the Bond market are at war. While the FED has cut rates, the bond
market is fighting back against the widely held view that inflation
is no longer a threat. The Bond market is the private sector response
to the Board of Governors at the FED. When the Bond market raises
yields, it is acting as “governor” on public sector
policy of spending and borrowing. In the 1980’s when this
happened, financial institutions nicknamed the bond market, the
"Bond Market Vigilantes”. If the politicians would
not control spending and borrowing, then the Vigilantes would
push
interest rates up at bond auctions, which would slow the economy
and make it tougher to get reelected. At least for now, it looks
like the Bond Vigilantes
have returned.
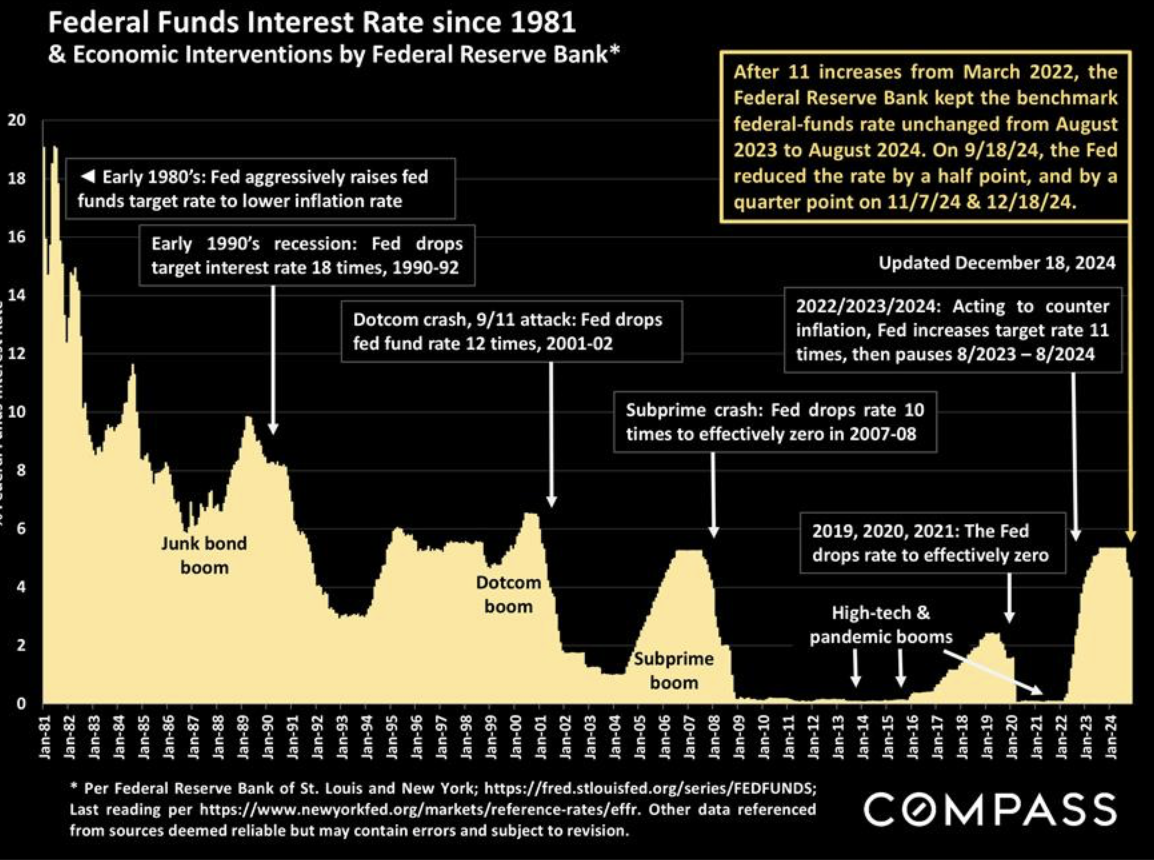
Interest Rates
On the chart below, last Sept 18th, just
as the FED began to reduce the FF rate, the inflation rate began
to rise again. In round numbers, the CPI rose from the low 2’s
to the 3% area. Also, during this same period, mortgage rates
also rose. This brings up an important point. While the FED controls
the Fed Funds rate, it does not control the interest rates at
which consumers borrow. Borrowingrates, essentially, follow the
perceived future inflation rate. This is done in the numerous
bond auctions held every month. When inflation is being perceived
as rising, financial institutions and investors, demand a higher
yield on the bonds they buy. And as bond yields rise, so do the
interest rates for consumers. So to conclude, the FED can only
influence interest rates, but not completely control them. In
times of low inflation, 2% or lower, the FED, the bond markets,
and borrowing
rates usually move in unison, in the same direction
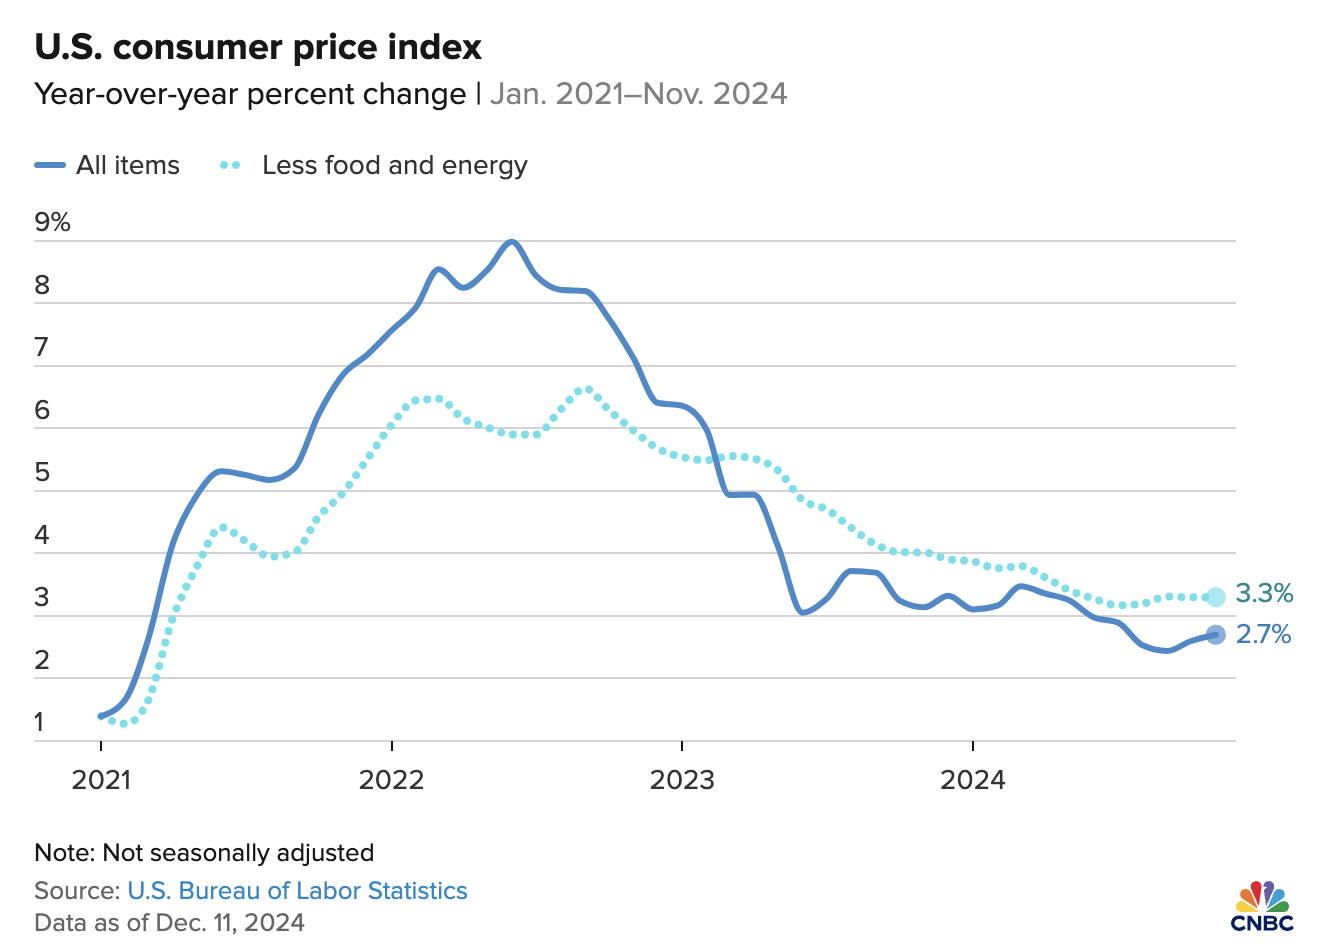
From Reagan to Biden.
This line graph shows the
FED’s progress on fighting inflation since mid 2022. While
the FED has made progress, note that the core rate is still higher
than the headline CPI rate of 2.7%. A higher core rate indicates
that inflation is still having a major effect on the economy as
a whole, even not counting food and energy costs. Remember,
the FED spent 15 months (2021 & part of 2022) telling us that
the inflation at that time was only temporary.
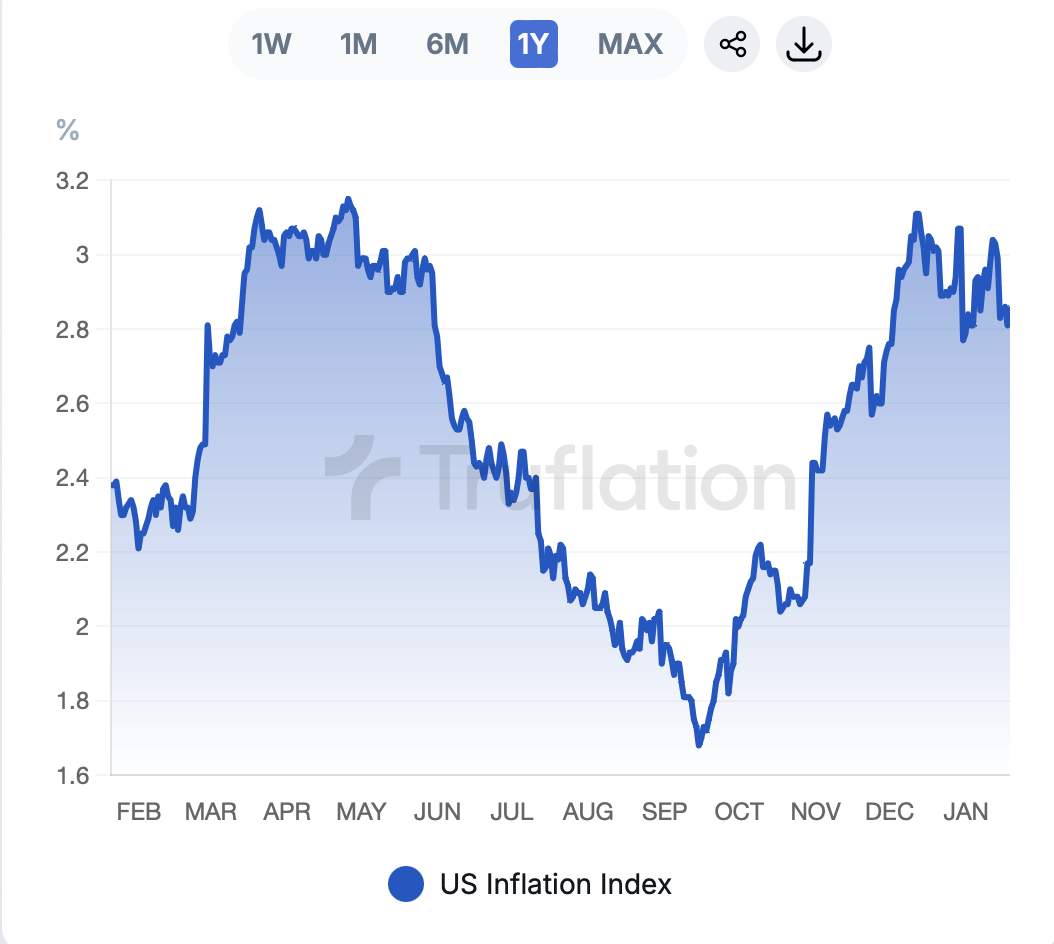
This chart zooms in on 2024
and shows that inflation started a comeback last September. It
also shows that this comeback is flattening out. So, from here
the questions is, where does it go next? If the inflation rate
continues to rise, then borrowing rates will continue to rise.
And of course, the opposite could also happen.
The Economy
The only potential threat that I see to
the economy would be renewed rising inflation. When inflation
rises to constrictive levels, this happens:
- borrowing and lending dry up
- investment slows
- the economy slows
- business revenues also fall
- layoffs rise
- public loses confidence and pulls back on spending
- some businesses fail & close
- the unemployment rate rises
- foreclosure rates rise due to job losses, loss of income
- distress sales in the home market starts a spiral of declining
prices
The most recent GDP number on the US economy was Q 3 at +3.1%,
no where near recession. If we go below 1% GDP, it won’t
officially be a recession, but it sure will feel like one. The
somewhat official definition of a recession is two months in a
row of growth below 0%, which would mean that the economy is actually
contracting / shrinking.Right now the US economy is nowhere near
recession. In the first 3 - 6 months of of 2025, a series of Trump
policies that are pro-growth are going to hit the economy, i.e.,
possible tax cuts and removal of 100’s of regulations that
quietly can strangle an economy. If legislation goes as planned,
the 2nd half of 2025 should be stronger. In taking a look at all
the "pieces are on the board”, I see no reason not
to be optimistic for 2025. However, there is always a caveat,
and that caveat would be what happens if inflation has a 2nd leg
up. If the CPI were to go above 4% that would mean 8% mortgages
and that would certainly lead to slower sales and falling home
values. As I said in my last Special Bulletin, I put a very low
probability on inflation rising dramatically…………..but
keep your eye on the inflation rate and that will tell you all
you need to know on the direction of the economy.
Questions? Need help or advice?
Call OR email.
Jim Patton, Broker
http://www.avLand.info
“since 1985, helping investors make
informed decisions"
BRE # 00776290
Office, outside AV 800-270-8770
Office, inside AV 661-943-8090
Fax - 661-793-7269
Jim Patton
jim@jpbroker.com
|